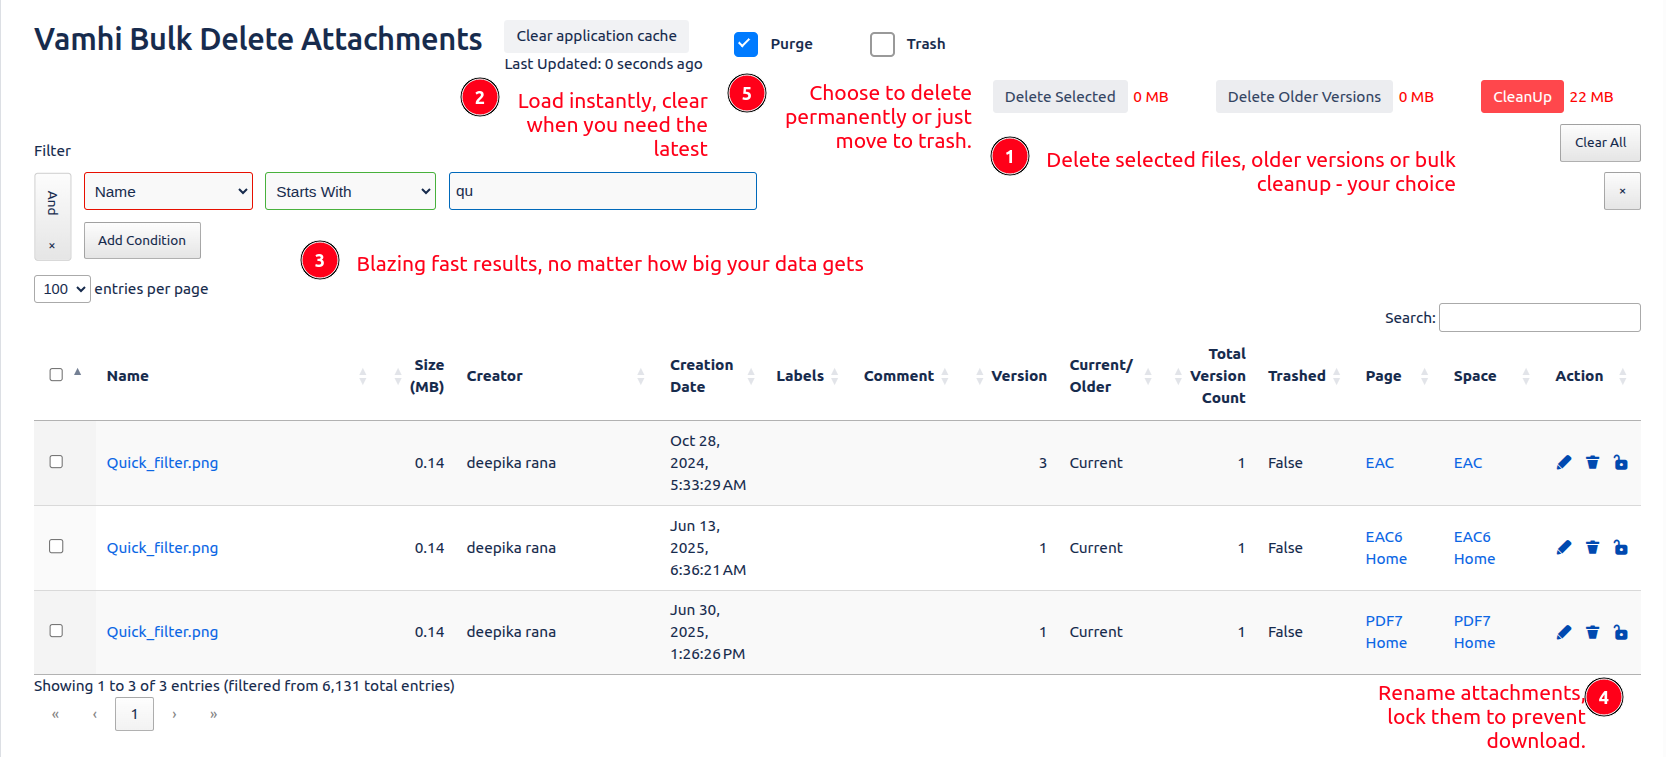
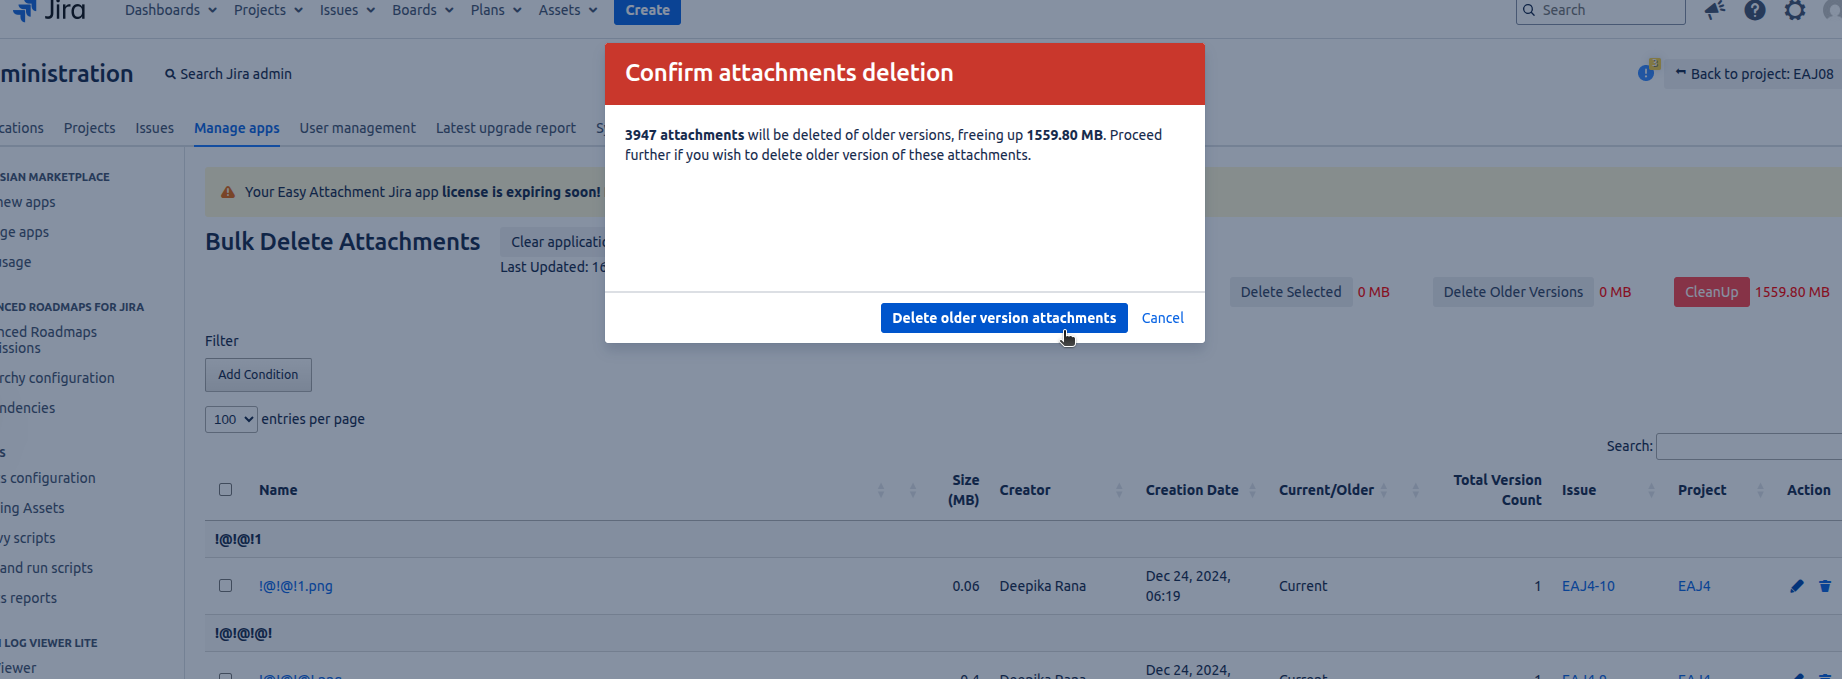
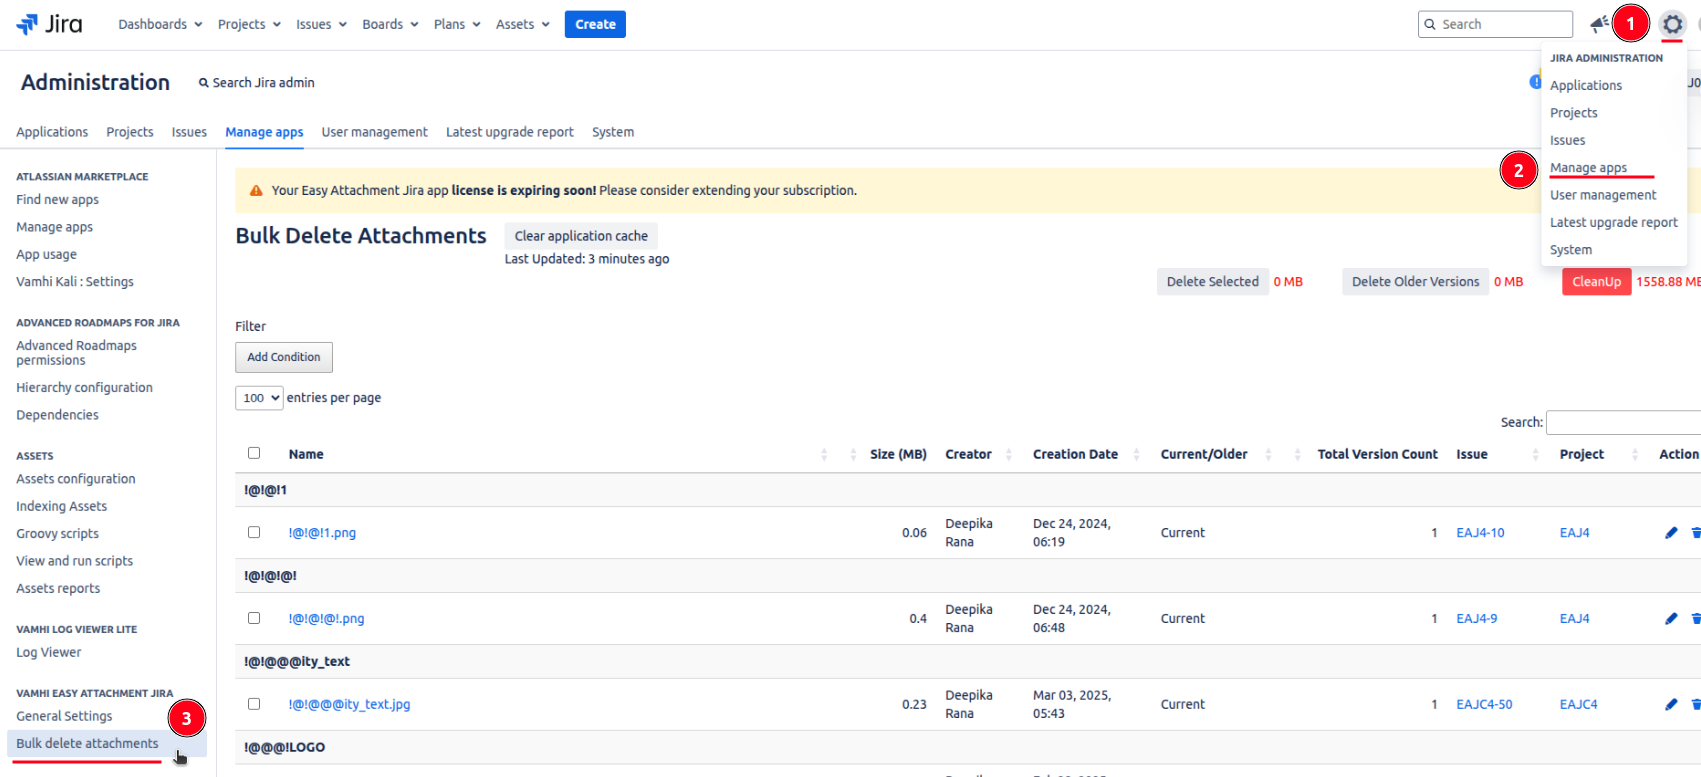
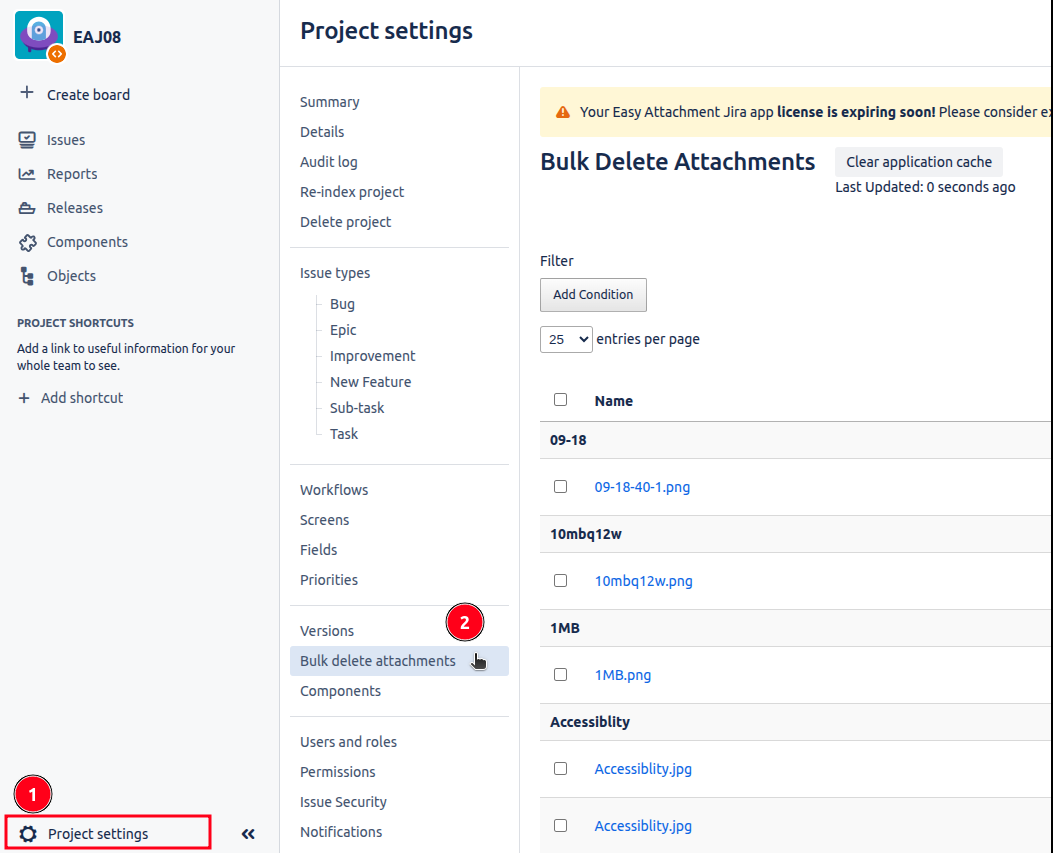
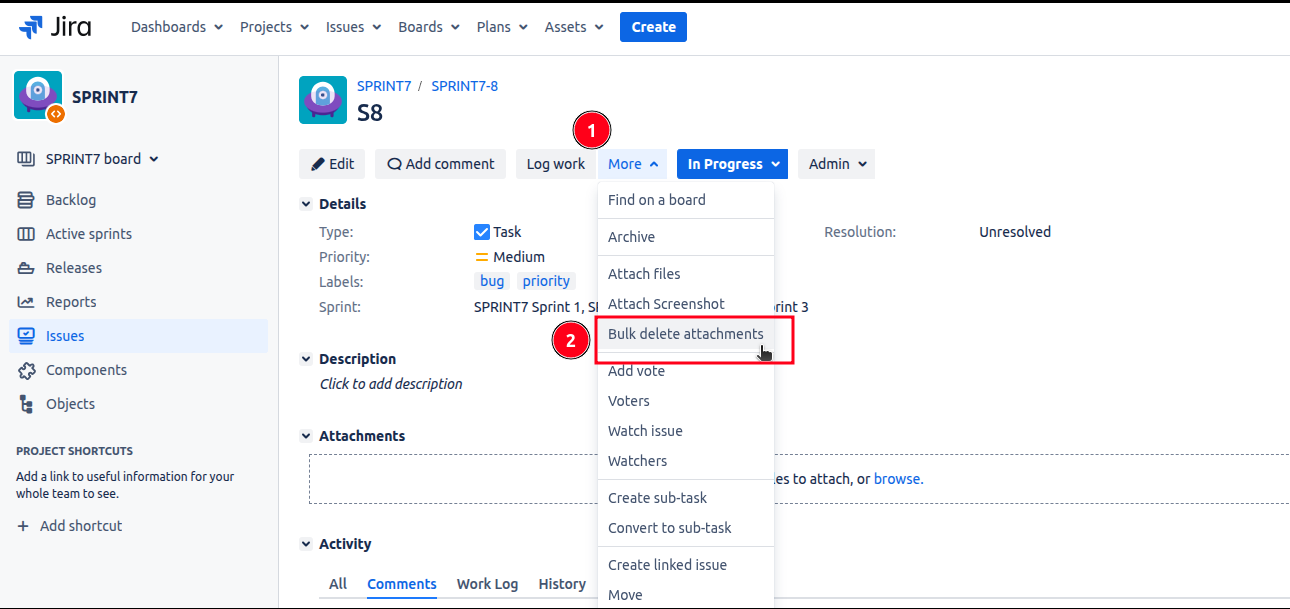
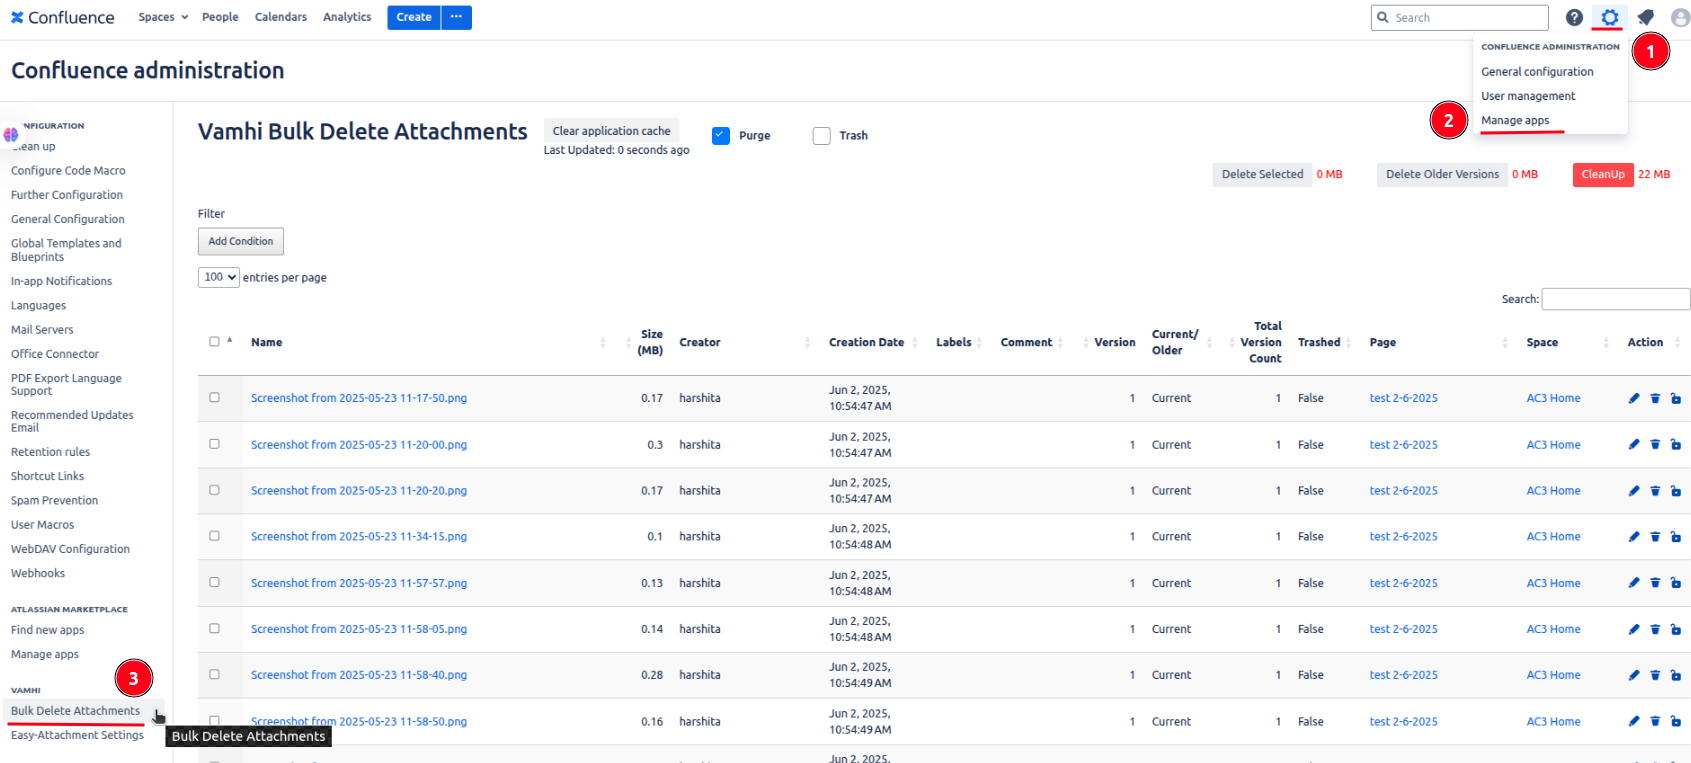
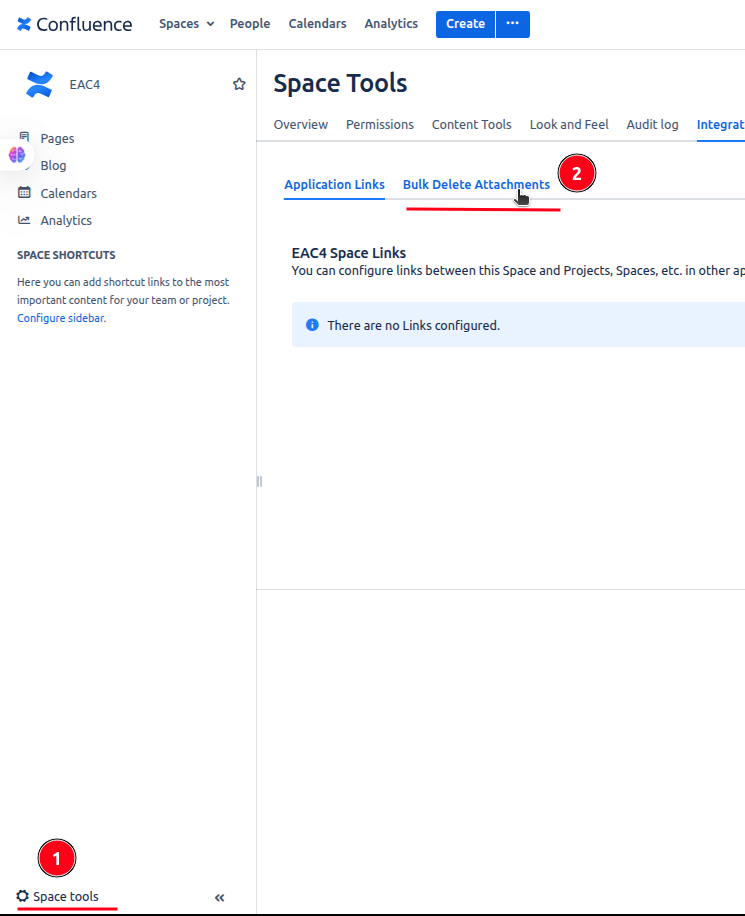
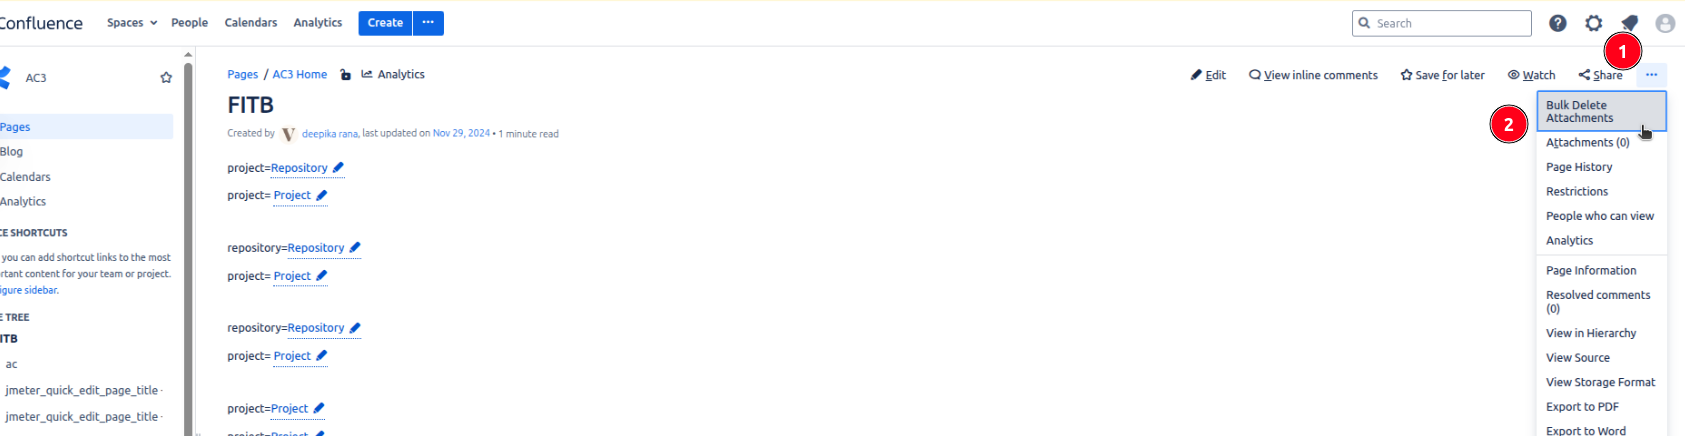
That means whether I’m cleaning up a single issue, a space-wide documentation dump, or handling admin cleanup across the site I can delete, rename, or lock attachments from anywhere.
⚡ What I Like the Most: Blazing Fast Performance with Smart Caching
One of the things that impressed me the most? How fast everyth
ing loads even with millions of attachments.
Vamhi Easy Attachment doesn’t just rely on brute force. It uses a smart caching system to quickly load data, and processes everything in manageable batches. The result? I get a lightning-fast response every time, without freezing up the UI or overloading the system.
Even when working with massive projects or large Confluence spaces, performance never slows down and that’s a game changer.
🚀 Blazing Fast & Memory-Efficient Plugin
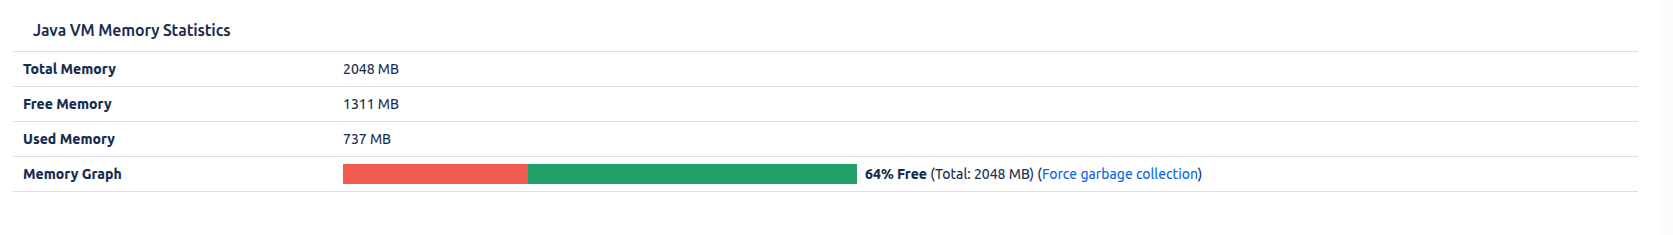
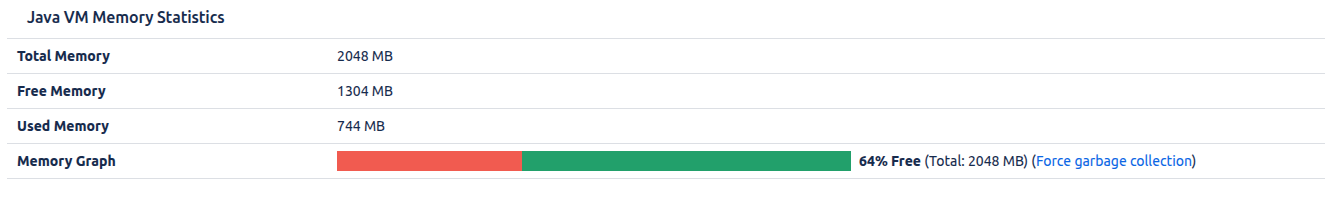
Even under active usage, our plugin demonstrates exceptional memory efficiency.
State | Used Memory | Free Memory | Total Memory |
|---|
✅ Without Plugin | 737 MB | 1311 MB | 2048 MB |
🧩 With Plugin | 744 MB | 1304 MB | 2048 MB |
🔍 Memory Overhead: Only 7 MB increase that’s just 0.34% of the JVM heap.
🧠 64% Free Heap remains untouched, proving how minimal and optimized the plugin is.
📈 Seamless performance with no garbage collection stress or spikes.
Built for performance. Engineered for efficiency.
⚡ Lightning-Fast API Performance & Load Times
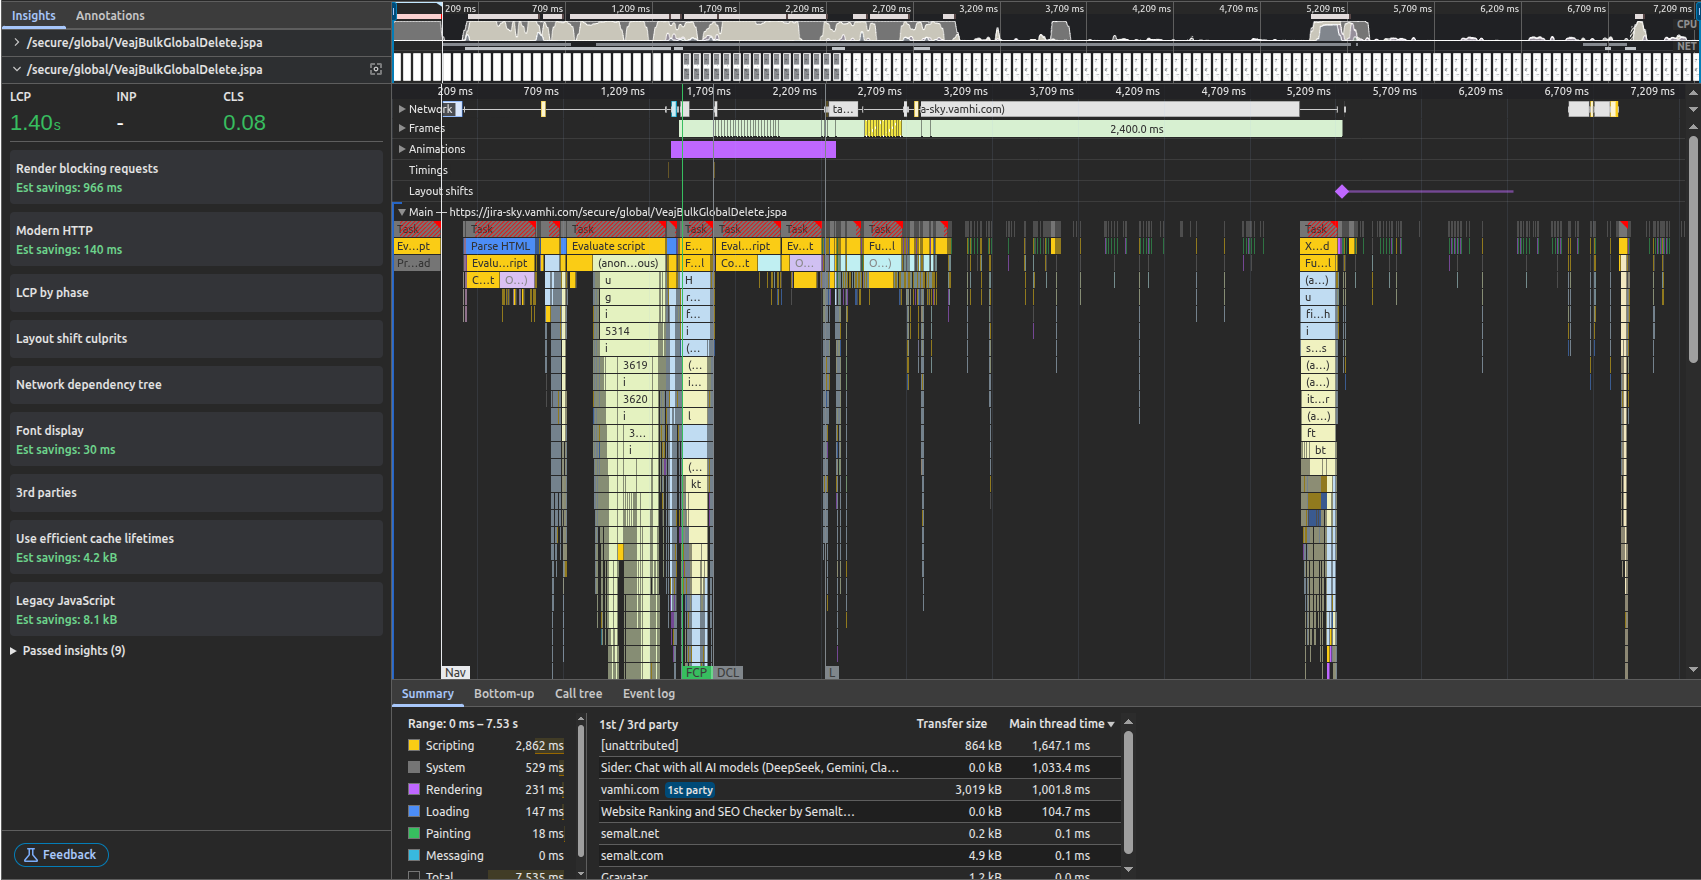
✅ 1. Lightning-Fast LCP: 1.40s
Largest Contentful Paint was hit at 1.40 seconds, well below the 2.5s “good” threshold.
This proves that the page's most important content became visible very quickly.
🟢 Google considers LCP < 2.5s as excellent. You’re faster than that.
✅ 2. Stable Layout – CLS: 0.08
Cumulative Layout Shift is just 0.08 well within the “Good” range (≤ 0.10).
Means your page is visually stable, without unexpected jumps while loading.
✅ 3. Zero Blocking Resources Detected
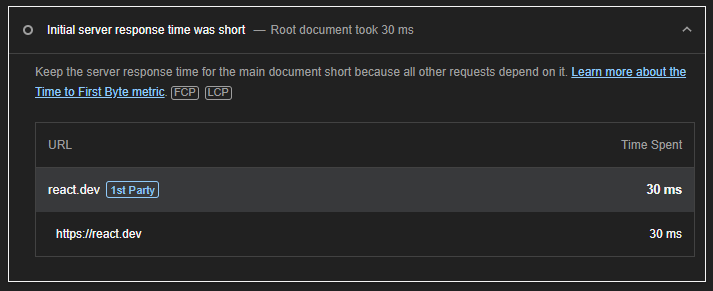
✅ 4. Efficient Use of HTTP:
Uses modern HTTP protocols, reducing connection overhead (140 ms savings).
Shows backend + network stack are well-tuned.
✅ 5. All Data Loaded in ~7.5 Seconds
The total time to full interactive (TTI) is under 7.53 seconds.
This includes everything: scripting, network, rendering, etc.
✅ 6. JavaScript Time Distribution
Phase | Time |
|---|
Scripting | 2.8s |
System | 0.5s |
Rendering | 0.2s |
Loading | 0.1s |
✅ 7. Efficient Third-Party Usage
✅ 8. FCP/DCL Timing
FCP (First Contentful Paint) hits around 1.2s
DCL (DOMContentLoaded) just after 2s
Indicates good separation of loading and execution phases.
Scenario | Metric |
|---|
Load 5000 attachments | 1.2s (measured via DOMContentLoaded) |
XHR requests per 1000 attachments | ~35–38 KB, < 3s load time per batch |
Total API throughput (5000+) | All batches fetched in ~7–12 seconds |
Attachment search filter response | < 400 ms |
✅ In Short...
Easy Attachment gave me back control. No more clutter, no more wasted time hunting for files, and our team can actually find what they need, when they need it.
If you’re feeling the same attachment overload, I highly recommend trying it out. There’s a free trial and once you use it, you won’t go back.
👉 Try Easy Attachment for Jira and Easy Attachment for Confluence, the tools that made attachment management simple again.
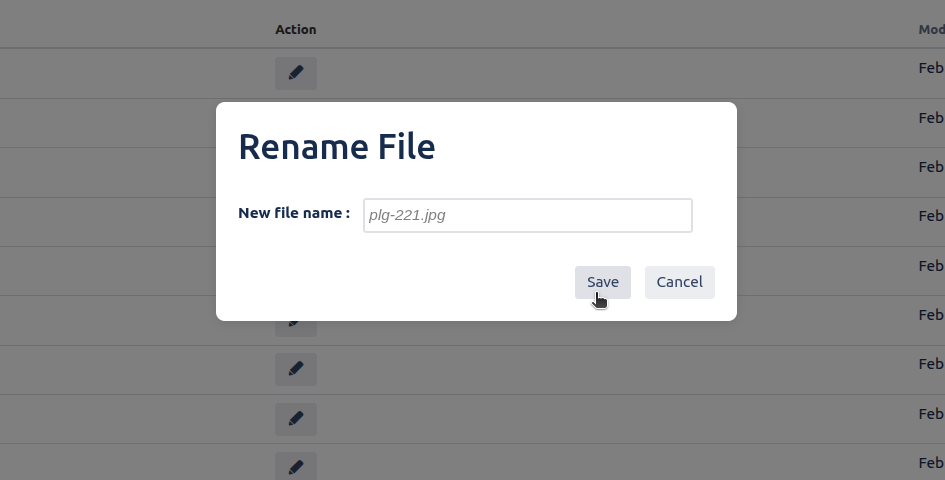
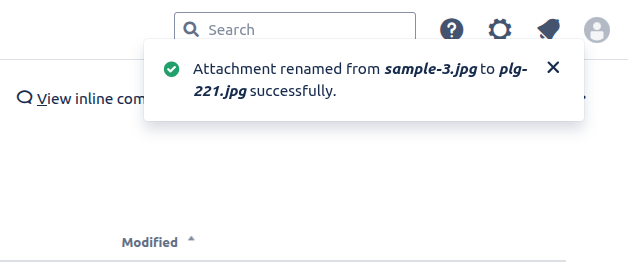
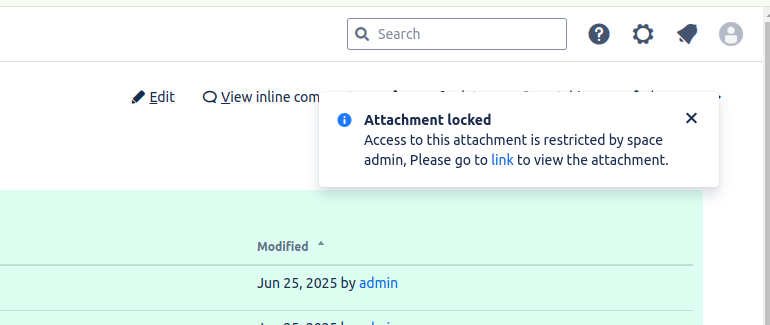
🔍 Bulk delete, rename, restrict, and clean up files all inside the Atlassian tools you already use.
.png)